
How to make a mind map
Learn how to make a mind map to visualize thoughts, organize ideas, understand complex topics, and develop creative solutions using FigJam.
Skip to main content
Team productivity

A brainstorm gives you ideas while a concept map tells you how those ideas connect. That distinction matters when you’re staring at a whiteboard and need to explain why one decision affects three others, or how a piece of user research ties back to a feature and the metric your team tracks.
The real value of a concept map is that it shows how ideas relate with an actual structure: parent concepts, child concepts, and labeled lines that spell out the relationship between them. Our research shows that the structure helps reduce friction, with 58% of designers highly satisfied with their jobs using whiteboard tools more often.
Read on to learn:
A concept map is a visual diagram built around labeled connections, so you can see the specific relationship between one idea and the next. It usually starts with the big idea at the top, then branches down into more specific ideas, kind of like a tree. Circles or rectangles represent each idea (called nodes), while lines or arrows show how they’re connected. Descriptive words define the relationship between ideas.
Concept maps make it easier to see connections, find what’s missing, and bring clarity to complex topics—so teams can stay aligned and move faster.
Most conceptual diagrams follow a top-down structure, but they don’t have to. The main goal is to make the relationship between ideas easy to follow. Here’s what all concept maps should include:
Concept maps aren’t one-size-fits-all. The right type depends on what you’re mapping and how it’s organized. Here are the four you’ll run into most and use cases for them:
| Map type | Structure | Example use case |
|---|---|---|
| Hierarchy | Branch from one broad idea at the top down into specific details | Breaking a feature into its smaller components |
| Spider | Radiate outward from a central topic in every direction | Mapping everything a new user persona might need |
| System | Connect ideas to each other freely, without a strict top-down order | Showing how teams and tools depend on each other during a launch |
| Flowchart-style | Move in sequence, guiding the reader through a process | An onboarding flow or approval process |
Let’s say your team is brainstorming a new product feature. Your team starts scribbling every idea that comes to mind around one central word, no particular order, just capturing everything. That’s a mind map, and it’s great for that first messy stage. But once you need to explain how those ideas actually fit together, like for a teammate or a stakeholder, a mind map starts to fall short.
It might show you had the idea of “user permissions,” but not how permissions relate to onboarding, or why that connection matters. That’s where a concept map takes over: it takes the same raw ideas and adds labeled connections that spell out the relationship between them.
| Concept map | Mind map | |
|---|---|---|
| Structure | Hierarchical, radial, or sequential, depending on the topic | Radial only, branching out from the center |
| Connections | Labeled lines that explain how ideas relate | Branches are labeled with a keyword, but the connecting lines aren’t |
| Best for | Explaining relationships and dependencies between ideas | Fast, free-form idea capture |
| Typical use case | Mapping how a new feature connects to existing systems | Brainstorming a first list of feature ideas |
Concept maps are easy to make. Start with FigJam’s concept map template, a clear problem or topic, then start to map out related ideas as you go, by yourself or with a team. Here’s a simple way to get started:

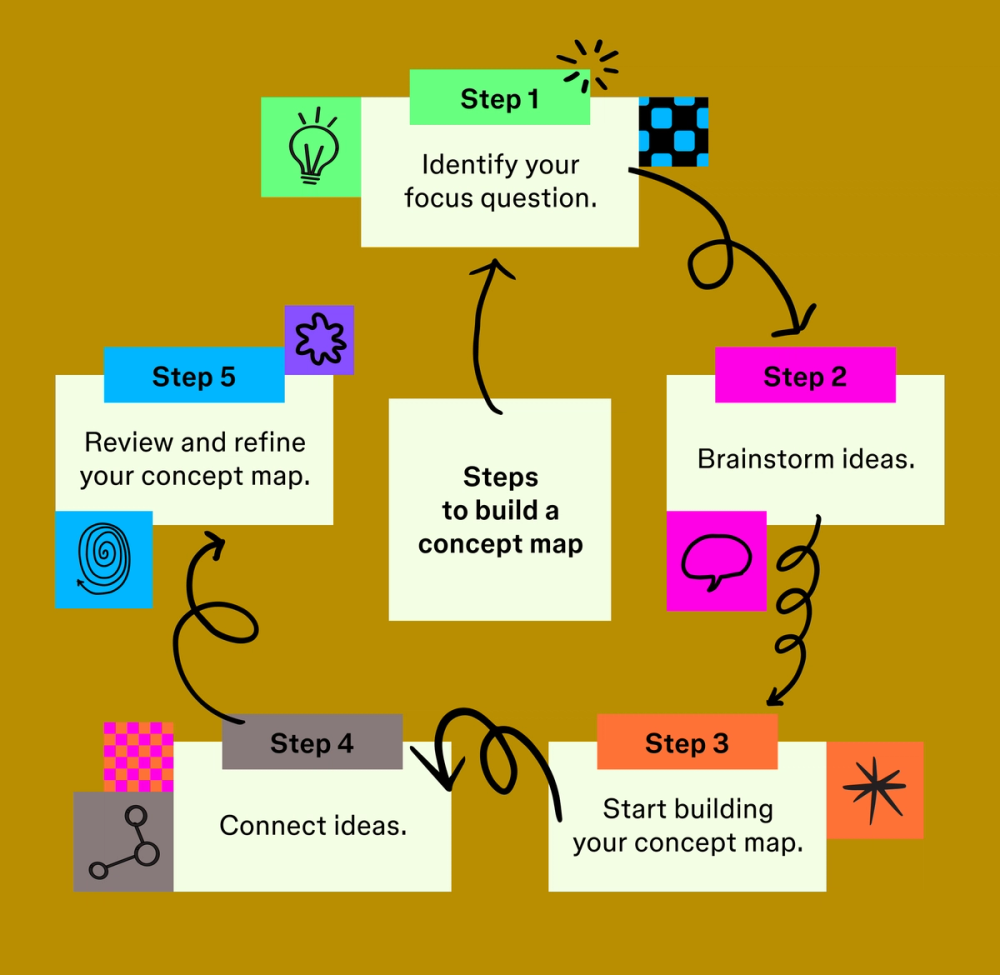
What’s the problem or topic you want to address? Start with a question that defines it. It could be something fixed, like “What are the keys for this quarter’s release?” Or you can start with something more open-ended, such as “How do users interact with our product?” You keep the map's focus clear and purposeful by asking specific questions.
Once the focus is clear, jot down ideas related to it. Start with the main concept, then branch out to connected themes, subtopics, or features. Keep labels short, just a word or two, so the map stays clear and scannable. If you’ve already talked an idea through an AI agent, you can turn that conversation into a FigJam diagram to jump-start this step instead of starting from a blank canvas.
Position your focus question at the top of your workspace, followed by your central concept directly beneath it. Arrange related concepts based on their logical connections.
As concepts branch farther out, they should get more specific, creating a hierarchy that shows how everything fits together.
Draw lines and arrows to cross-link related ideas. Add link words such as “includes,” “consists of,” or “leads to,” to clarify the relationships between ideas. These link words help turn the map into something teammates can understand at a glance.
Look at your map as a whole. Is it well-organized? Do your link words make sense? Make sure all key concepts are included, and adjust the layout, link words, or connections as needed. The more precise your map diagram becomes, the more useful it is as a reference or conversation tool.
Designers, product teams, and project leads use concept maps to untangle complexity, find gaps, and organize ideas visually. Here are a few ways they can show up in real workflows.

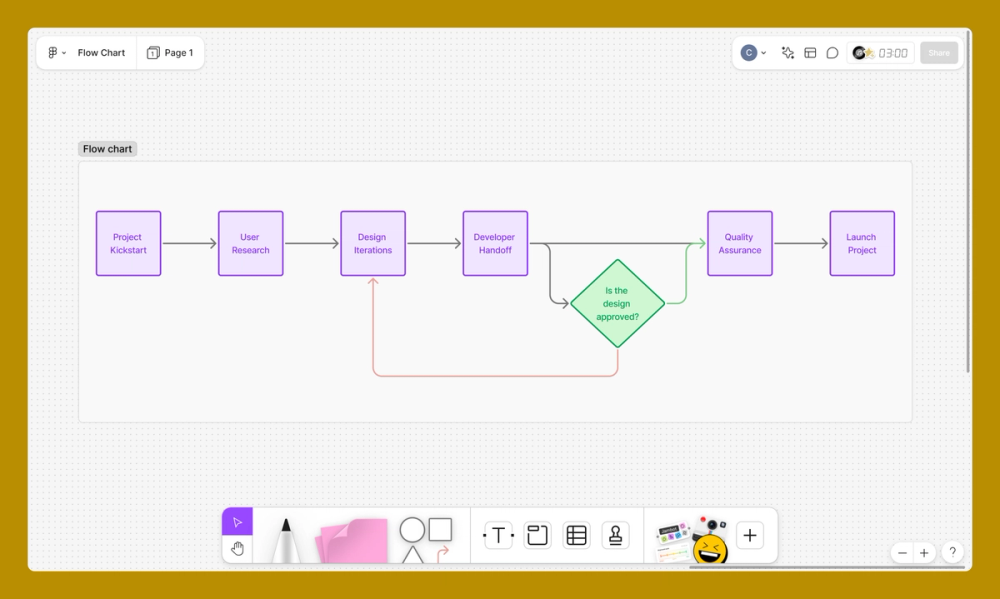
If you are planning a project, a simple flowchart can help clarify the key phases from start to finish. Begin with a box called “Kickoff,” then draw arrows to boxes for “User Research,” “Design Iterations,” “Developer Handoff,” and “Quality Assurance.” Add decision diamonds to show potential branching paths. This gives everyone a shared view of what’s happening—and what’s next.
As a UX designer, you can map out how a user interacts with a Web page or app. A user flow diagram shows the user’s path. Start with a circle for “Landing Page,” then draw arrows to boxes for “Sign up,” “Product Exploration," and “Checkout.” Include decision diamonds for actions like “Forgot Password?” This map helps you identify usability issues and improve the user experience.
Graphic designers and product managers can use concept maps to organize a design system. Start with a box for “Design System,” then branch out to core areas. Use boxes for “Typography,” "Color Palette,” “Iconography,” and “Components.” Under "Components,” break it down into more specific elements: “Buttons,” "Forms,” "Cards.” This structure gives it a clear hierarchy and helps teams stay consistent as the design system evolves.
Concept maps started as a learning tool at Cornell University, where researchers asked students to sketch out their understanding of complex topics on a single page. Since then, they’ve become a go-to tool for designers, product teams, and educators who need a fast, visual way to make sense of information.
Concept maps support how people actually learn. They help visual learners, about 65% of the population, understand complex concepts more quickly. They also make ideas easier to follow for people with different learning styles and levels of expertise. A good map puts the most important information front and center, so key details stay easy to reference and remember.
That same structure sharpens how teams think through a problem. Mapping out dependencies and edge cases pushes loose ideas toward something more concrete and easier to act on.
A rough first version is fine—but with a few small tweaks, your concept map can go from helpful to genuinely clear and impactful. Here are some ways to get more out of it:
You don’t need much to start a concept map, just one central idea and a blank FigJam board. By using the features within FigJam, you can streamline the concept mapping process and create impactful visual representations of your ideas. Here’s how:
FigJam is an online whiteboard where you and your team can build concept maps together in real time.
Learn how to make a mind map to visualize thoughts, organize ideas, understand complex topics, and develop creative solutions using FigJam.

Explore 24 mind map examples to find the best template for brainstorming new ideas, simplifying complex topics, and encouraging cross-team collaboration.


Demystify project timelines by learning what a Gantt chart is and what it’s used for. Plus, discover how to make a Gantt chart in five simple steps.

Use an empathy map to turn user feedback into meaningful design decisions. This guide covers key elements, best practices, templates, and more.

Graphic design focuses on creating visuals to convey a message or story. Read on to learn about graphic design and how Figma can help.

UX design is the creation of digital products around user needs and expectations. Learn key principles, skills, and how to use Figma for UX design.